Step 0: Install Docker
- If you haven’t already, install docker and the git client of your choice.
If you aren’t familiar with these tools, check out these docker and git tutorials.
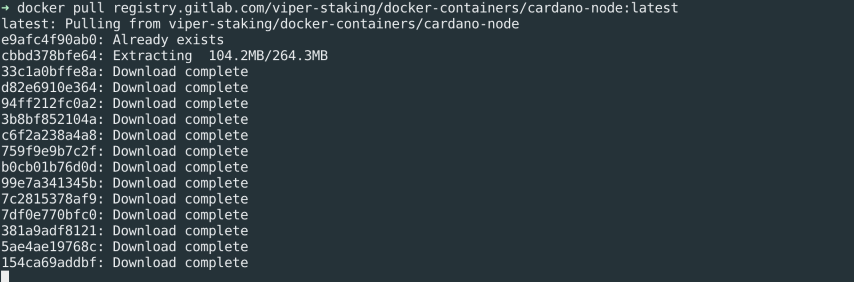
Step 1: Pull cardano-node docker container and repository
- Open a terminal and run the following commands:
git clone https://gitlab.com/viper-staking/cardano-node-setup.git
git clone https://gitlab.com/viper-staking/docker-containers.git
docker pull registry.gitlab.com/viper-staking/docker-containers/cardano-node:latest
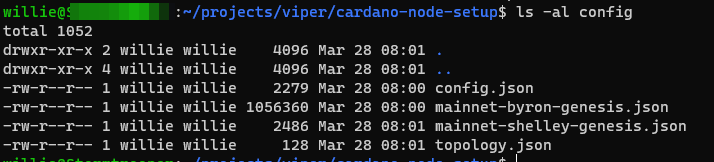
Step 2: Download Cardano network config files
- Download the config files for the desired network you’d like to connect to (testnet, mainnet, etc). You can use the download script we provide in our GitLab repository. You will need to rename the desired set of config files as follows:
- config.json
- mainnet-shelley-genesis.json
- mainnet-byron-genesis.json
- topology.json
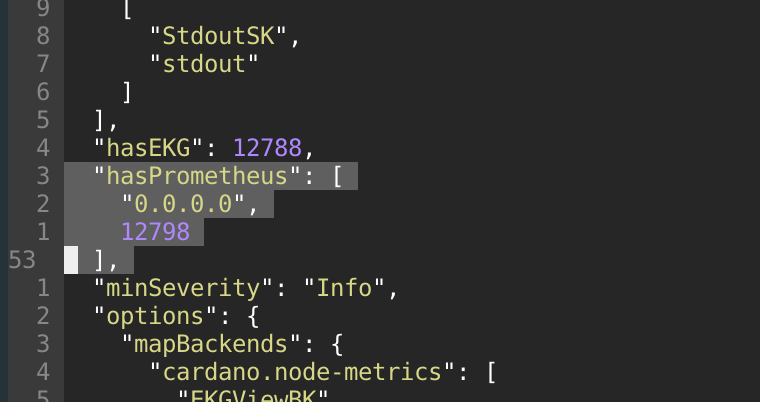
- If you would like to use Prometheus to monitor your cardano-node, open
config.jsonand make sure the following lines are present (IP address must be 0.0.0.0):
Step 3: Run cardano-node docker container
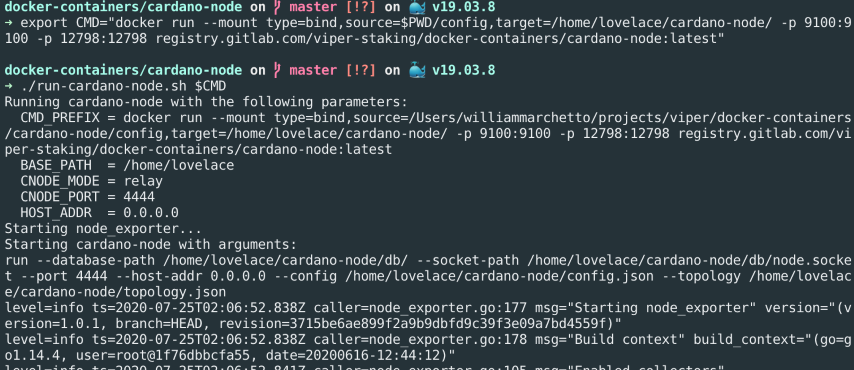
- The following commands will set the command parameters to run cardano-node as a relay in the docker container and then run the container:
export CMD="docker run --mount type=bind,source=$PWD/config,target=/home/lovelace/cardano-node/ -p 9100:9100 -p 12798:12798 -p 4444:4444 registry.gitlab.com/viper-staking/docker-containers/cardano-node:latest"
./run-cardano-node.sh "$CMD"
If you get an error about docker permissions, try the fix outlined here
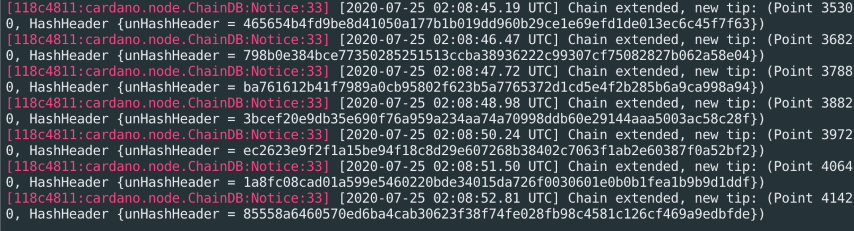
- If the previous commands were successful, you should see output messages like this, which confirm you have connected to the Cardano network and are fetching the latest blocks:
Step 4: (Optional) Monitor the cardano-node using Prometheus
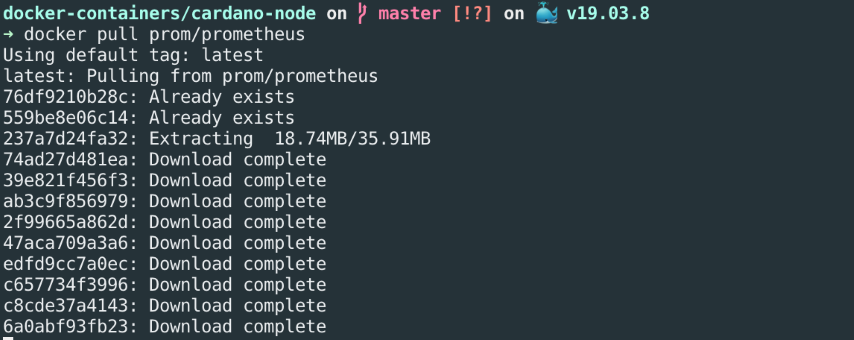
- Download the Prometheus docker container using the following command:
docker pull prom/prometheus
- Get the IP address of your running cardano-node docker container with the following command:
docker network inspect bridge
-
Modify
prometheus.ymlfrom the cardano-node repository and changelocalhostto the container’s IP address. -
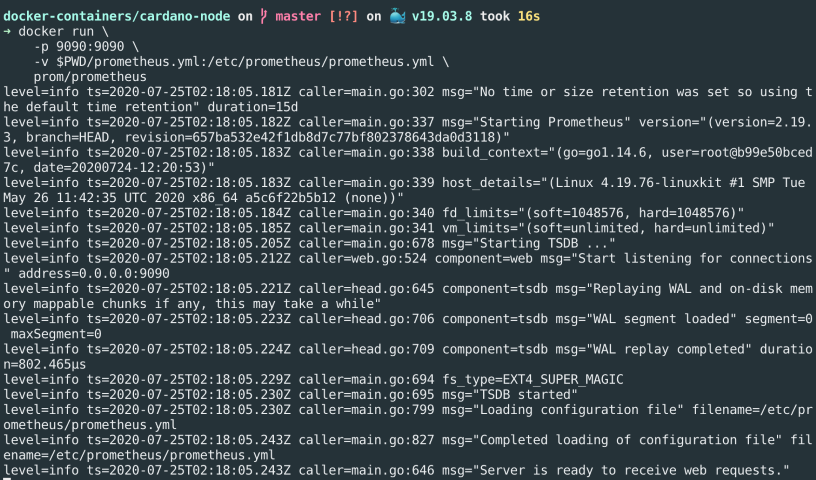
Run the Prometheus container (make sure you are in the cardano-node repository):
docker run \
    -p 9090:9090 \
    -v $PWD/prometheus.yml:/etc/prometheus/prometheus.yml \
    prom/prometheus
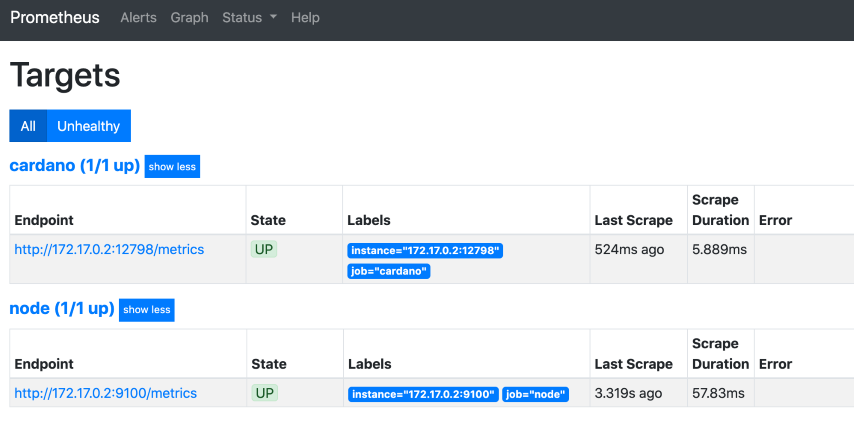
- Make sure Prometheus has connected to the cardano target by going to
http://localhost:9090/targets(if docker port forwarding is setup) orhttp://<prometheus_container_IP>:9090/targetsin a browser.
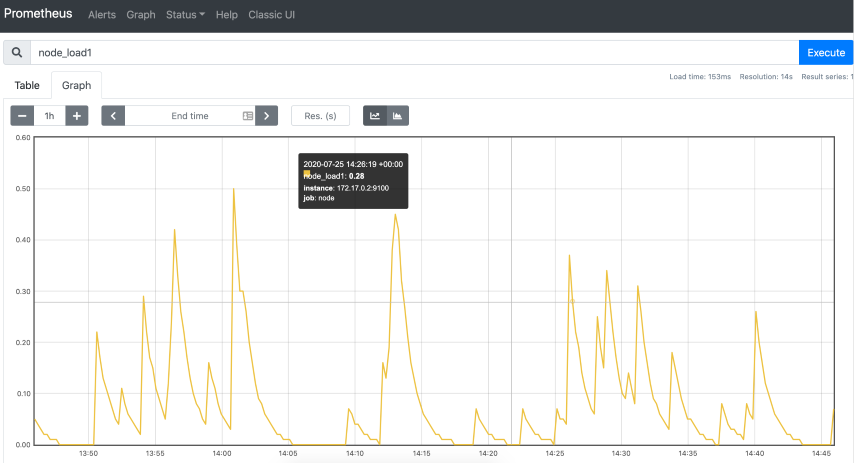
- Your cardano-node can now be monitored via
http://localhost:9090/graphorhttp://<prometheus_container_IP>:9090/graph!
Step 5: (Optional) Setup a Grafana dashboard for Prometheus
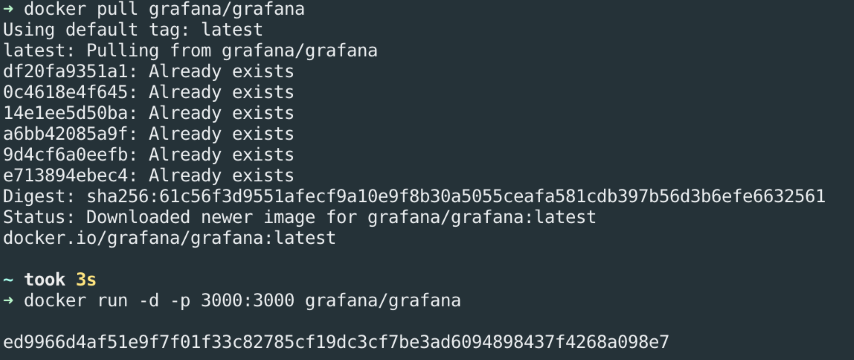
- Download the Grafana docker container using the following command:
docker pull grafana/grafana
- Start up the Grafana container:
docker run -d -p 3000:3000 grafana/grafana
-
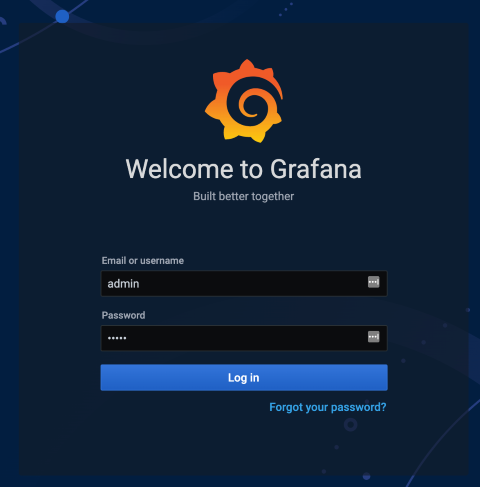
Open the Grafana web interface by going to
localhost:3000or<grafana_container_IP>:3000 -
Login with the default username/password:
admin/admin:
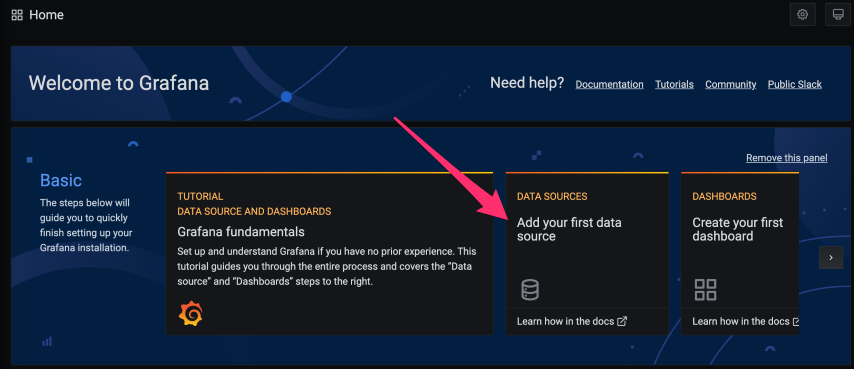
- On the home screen, select “Add your first data source” and then select “Prometheus”:
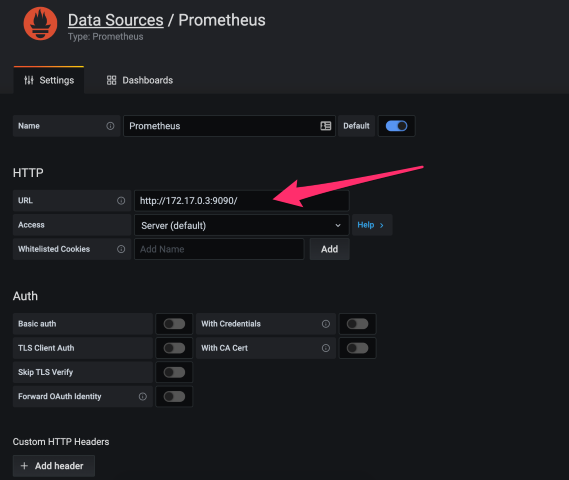
- Enter the IP of the Prometheus docker image and then select “Save & Test” (the rest of the settings can be left to the defaults):
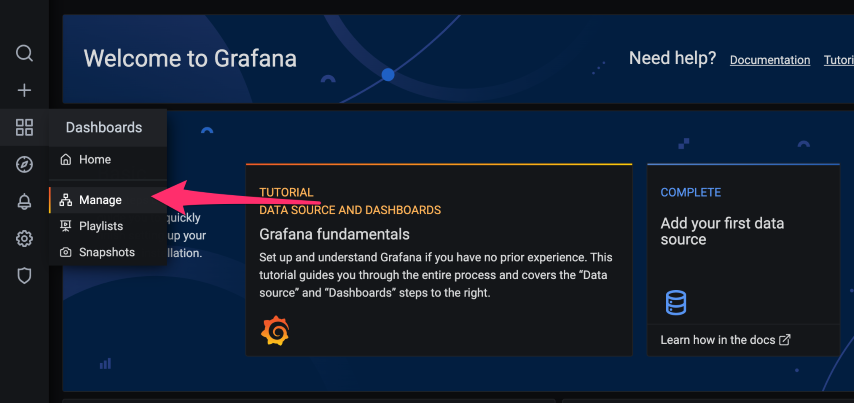
- Return to the home page and select “Dashboards > Manage”:
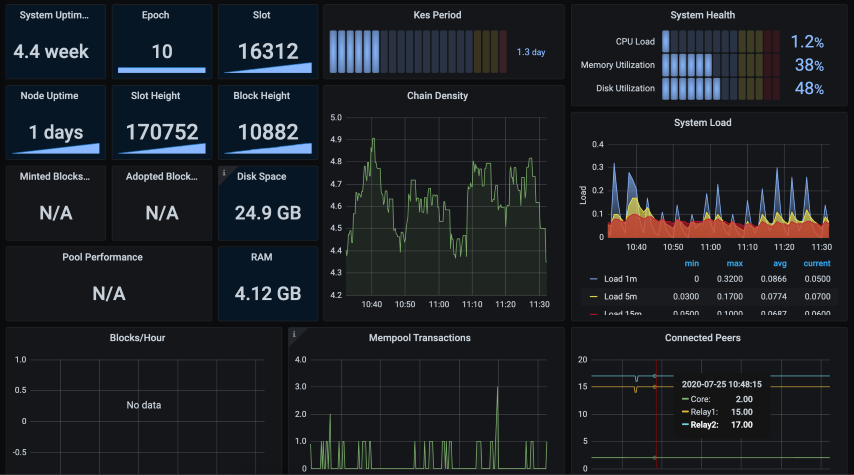
- Select “Import” and then paste the JSON for the example dashboard.
More usage examples
For mode examples, see the README in our cardano-node GitLab repository.
If you find our tools helpful and would like to support future development, please consider buying us a beer! ![]() Contribute
Contribute